
Figure 2. Cell area and Nav1.8-LI relative intensity.
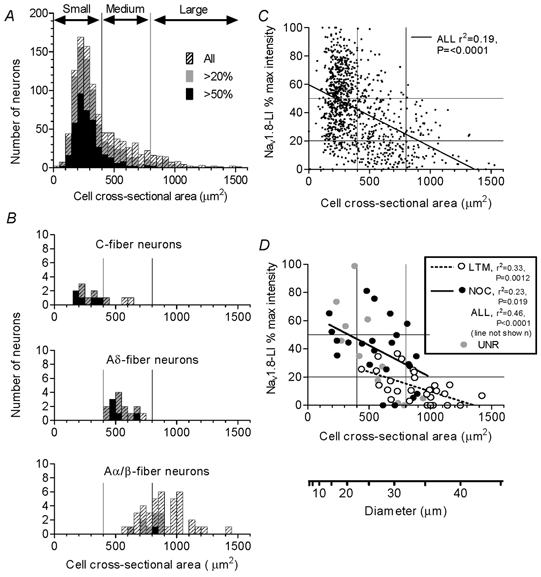
The cross-sectional areas (x-axis) through each neuronal profile containing a nucleus (A) and through the largest section of each identified dye-injected neuron (B) are plotted against the relative intensity (percentage maximum intensity). In both cases, all neurons are shown as hatched histograms. Superimposed in grey are neurons with Nav1.8-LI relative intensity > 20 % and superimposed in black are those with > 50 % maximum intensity. B, histograms for neurons with dorsal root C-, Aδ- and Aα/β-fibres are displayed separately. C and D, relative intensity is plotted against cell size. The lines (y-axis) show 20 and 50 % relative intensity, and those on the x-axis show the borderlines between small, medium and large neurons. C and D, regression lines, r2 and P values are given where a significant correlation exists (P < 0.05). LTM, low threshold mechanoreceptors; NOC, nociceptors; UNR, unresponsive units.