
Figure 2. Resting membrane potentials at selected [K+]o in rat ventricular myocytes.
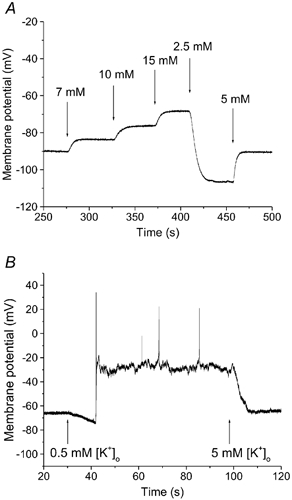
A, representative perforated patch recording from a quiescent right ventricular myocyte in response to selected changes in [K+]o, between 2.5 and 15 mm. Increases in [K+]o produced depolarization; while 2.5 mm [K+]o caused hyperpolarization of the resting membrane potential. B, representative recording from a rat right ventricular myocyte at 5 and 0.5 mm [K+]o. Note that, as expected, in 0.5 mm [K+]o after an initial hyperpolarization, the myocyte depolarized, and fired a number of action potentials. Arrows indicate the start of application of each [K+]o.