
Figure 4. Chemically induced hypoxia followed by reoxygenation results in changes in [Ca2+]i in rat ventricular myocytes at four different [K+]o levels.
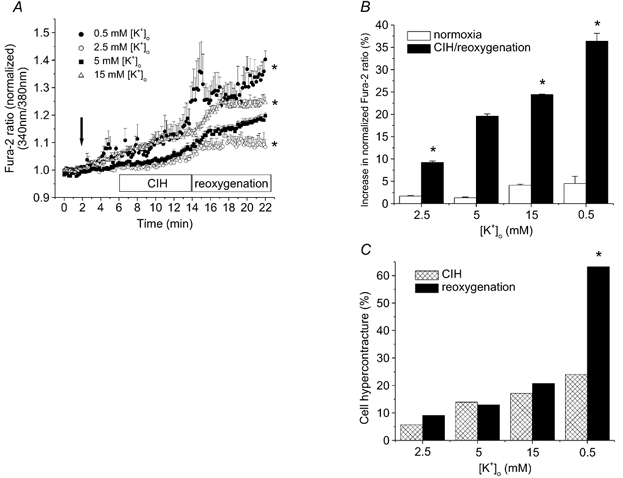
A, [Ca2+]i measurements (i) under control conditions (after 2 min in 5 mm [K+]o), (ii) after 4 min in each selected [K+]o, and (iii) during 8 min chemically induced hypoxia (CIH), (iv) followed by 8 min reoxygenation. The arrow denotes the time when [K+]o was changed. B, increase in [Ca2+]i load during the 4 min normoxic and 8 min CIH per 8 min reoxygenation period at selected [K+]o. The last three points of reoxygenation and of the period preceding CIH from panel A were used to construct panel B. C, effect of [K+]o on myocyte viability during hypoxia-reoxygenation. Hypercontracture was defined as a marked reduction in cell length. * P < 0.05 vs. control (5 mm [K+]o), n = 6 experiments and 2–6 cells per experiment.