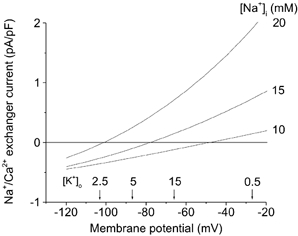
Figure 6. Mathematical simulation of Na+–Ca2+ exchange current as a function of membrane potential at selected [Na+]i and [K+]o.

Na+–Ca2+ exchange current is shown assuming control (10 mm) and elevated [Na+]i. Arrows denote our experimental measurements of diastolic membrane potentials resulting from superfusion of ventricular myocytes with a solution containing selected [K+]o (mm). This simulation was done using the software described in Puglisi & Bers (2001).
