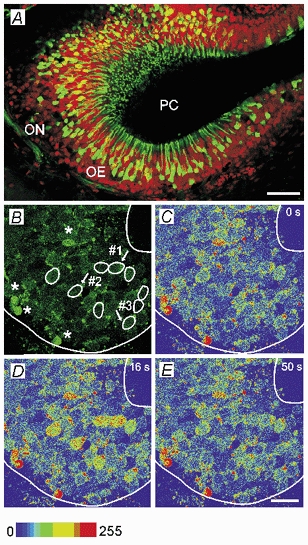
Figure 1. Slice of the olfactory epithelium of a Xenopus laevis tadpole and amino acid-induced [Ca2+]i increases in individual ORNs in a mucosa slice.

A, overview of a horizontal slice of the olfactory epithelium of a Xenopus laevis tadpole (stage 52, PC, principal cavity, OE, olfactory epithelium and ON, olfactory nerve). The neurons were backfilled through the nerve using biocytin-avidin staining (green fluorescence), and then the slice was counterstained with propidium iodide (red fluorescence). B, fluorescence image of a mucosa slice (stage 52, image acquired at rest) stained with fluo-4. Amino acid-sensitive ORNs are encircled. * ORNs showing high basal fluorescence levels at rest. The responses to amino acids of the ORNs indicated by arrows are shown in Fig. 2. C-E, sequence of three pseudocoloured images of the slice showing that stimulation with a mixture of amino acids (200 μM, each) transiently increases calcium-dependent fluorescence in the ORNs encircled in B. C, before the application of the amino acid mixture (time (t) 0 s). D, at the peak of the response (t, 16 s) and E, after return to the basal fluorescence level (t, 50 s). Scale bars: 50 μM in A and 20 μM in B-E.
