
Figure 2. Comparison of Ca2+ and tension responses in slow-twitch and fast-twitch fibres.
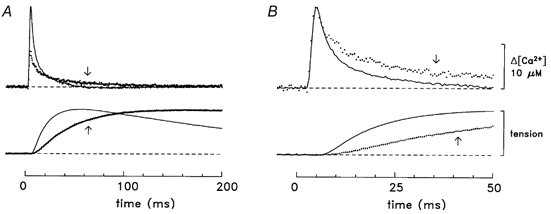
A, Δ[Ca2+] and twitch tension averaged from four experiments with soleus muscle (dotted lines, identified by arrows) and seven experiments with EDL muscle (continuous lines) of the type illustrated in Fig. 1. The selected experiments had minimal contamination of the Δ[Ca2+] signal by movements artifacts. The mean diameter of the fibres was 37 ± 6 μm for soleus and 41 ± 2 μm for EDL muscle. Where necessary, records were temporally shifted (average shift, 1 data point = 0.5 ms) to align the rising phases of the Δ[Ca2+] signals. The total number of Δ[Ca2+] responses averaged was 31 for soleus and 13 for EDL. The slow-twitch Δ[Ca2+] record has a peak amplitude of 8.0 μM, a time to half-rise of 3.4 ms, a time to peak of 4.5 ms and a half-duration of 7.6 ms; the corresponding values for the fast-twitch record are 18.2 μM, 3.5 ms, 4.5 ms and 4.8 ms, respectively. The tension response from each experiment was scaled to unity amplitude prior to averaging. The slow-twitch tension record has a time to half-rise of 38 ms, a time to peak of 184 ms and a half-duration of 767 ms; the corresponding values for the fast-twitch record are 17 ms, 54 ms and 215 ms, respectively. B, same traces as in A displayed on a faster time base and with the slow-twitch Δ[Ca2+] scaled to have the same peak amplitude as that of the fast-twitch Δ[Ca2+]. Temperature, 16 °C.