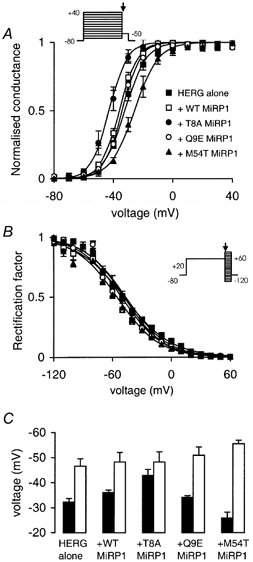
Figure 1. Effect of mutant MiRP1 subunits on steady-state activation of HERG.

Steady-state activation (A) and steady-state inactivation (B) curves for HERG alone (▪) and HERG co-expressed with WT (□), T8A (•), Q9E (○) or M54T (▴) MiRP1 subunits. The protocols used to record currents for activation and inactivation are illustrated in the insets (see text for further details). C, summary of the V1/2 of activation (▪) and inactivation (□) for HERG alone and HERG expressed with WT or mutant MiRP1 subunits. Data are means ± S.E.M. (n = 4-7).
