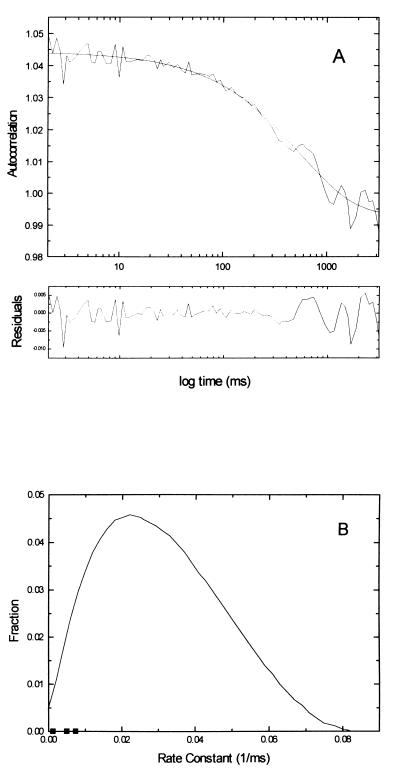
Figure 6.
(A) Autocorrelation of the fluorescence intensity of the single-molecule measurement seen in Fig. 5A and theoretical stretched exponential curve of β = 0.83. (B) Distribution of pi from a fit of the stretched exponential data from ref. 1 to Eq. 3 with the relaxation rates of the three cases of conformational fluctuations seen in Fig. 5 inserted.

