
Figure 5. Single MEPs, SICI and ICF obtained with digital nerve stimulation.
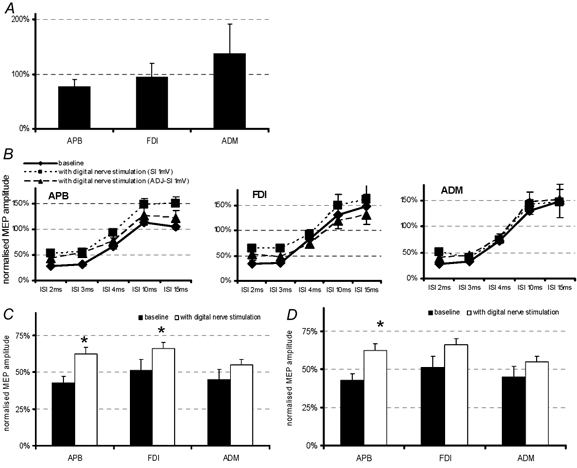
A, mean (± s.e.m.) MEPs in response to single TMS pulses during stimulation of the digital nerves of the index finger (SI 1 mV) expressed as percentages of baseline values without stimulation. Index finger stimulation had no significant effect on the size of any MEP, although there was a tendency for MEPs to be smaller in the APB and larger in the ADM. B, normalized MEP amplitudes obtained with both test pulse intensities. The different symbols indicate data collected without digital nerve stimulation (♦) and with digital nerve stimulation and test pulse intensities of SI 1 mV (▪) and ADJ-SI 1 mV (▴). C, SICI (mean of ISI 2, 3 and 4 ms as percentage of test MEP size ± s.e.m.) at rest and during index finger stimulation. Index finger stimulation reduced SICI in all three muscles to the same extent. D, ICF (mean of ISI 10 and 15 ms as percentage of test MEP size ± s.e.m.) at rest and with index finger stimulation. Stimulation increased ICF in APB, but had no effect in other muscles. C and D show pooled data obtained with test stimulus intensities of SI 1 mV and ADJ-SI 1 mV since the individual results from each intensity were not different from each other. Asterisks indicate values significantly different from the baseline without index finger stimulation (paired t test; *P < 0.01).