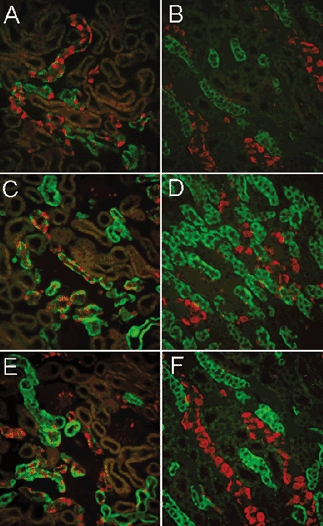
Figure 5. Distribution and levels of sgk1 expression in animals with various levels of steroids.

Left and right columns correspond to sections from cortex and outer medulla, respectively. All panels show double-labelling of sgk1 (green) and AE1 (red). A and B, bilateral adrenalectomy with high-salt diet; C and D, bilateral adrenalectomy with dexamethasone infusion by minipump. E and F, low-salt diet for 1 week. Immunoreactivity is reduced by adrenalectomy but levels return to baseline values with administration of dexamethasone. The reduction in sgk1 expression is not selective to the CCT but also is seen in the TAL. Sodium depletion did not increase the signal of sgk1.
