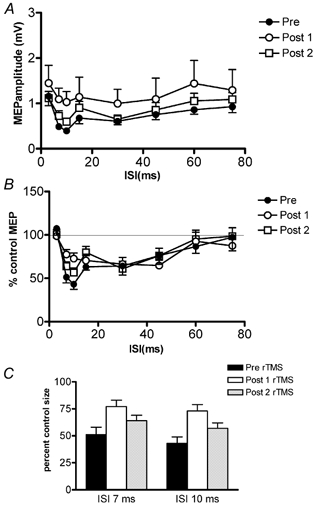
Figure 3. Effects of 15 min, 1 Hz rTMS delivered over the left motor cortex on the left-to-right interhemispherical inhibition.

The time course of the test MEP inhibition before rTMS (filled symbols) and time course after rTMS (open symbols). Post 1 (○) was performed immediately at the end of rTMS and post 2 (▪) was performed 10 min after the end of rTMS. A, the mean (± s.e.m.) amplitude of the test MEP measured in mV whilst B plots the same data as percentage inhibition. C, summary of the amount of inhibition at ISI 7 and 10 ms. Note that the amount of inhibition was much greater before rTMS.
