
Figure 3. Real-time quantitative RT-PCR analysis of mRNA expression of mitochondrial DNA (mtDNA)-encoded cytochrome c oxidase subunit I (COX I) and nuclear DNA (nDNA)-encoded cytochrome c oxidase subunit IV (COX IV) in left ventricle (LV), soleus (SOL) and gastrocnemius (GAS) of sham-operated and CHF rats.
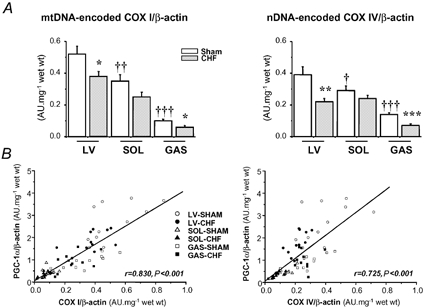
A, results are given as means ± s.e.m. of values normalized to β-actin transcription and multiplied by total RNA (mg wet weight)−1. *,†P < 0.05; **,††P < 0.01; ***,†††P < 0.001 versus respective Sham group (*) or versus Sham LV (†). B, correlations between the mRNA levels of COX I or COX IV and PGC-1α (peroxisome proliferator activated receptor gamma co-activator 1α). r, the correlation coefficient; P, the statistical significance.