
Figure 6. Sensitisation of TRPV1 by NCF following inhibition of PKC, PKA and CaMK II.
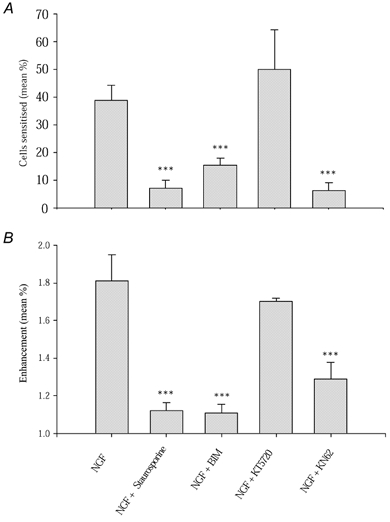
A, the proportion of neurones sensitised by NGF in the presence of 200 nm staurosporine, 500 nm BIM to inhibit PKC, 200 nm KT5720 to inhibit PKA and 1 μm KN-62 to block CaMK II activity. B, mean ratio values of sensitised neurones. Error bars show means ± s.e.m. Significance levels: ***P < 0.1 %.