
Figure 7. Cellular location of PKCε following exposure to bradykinin (left, 1 μm for 30 s) and NGF (100 ng ml−1, 2 min).
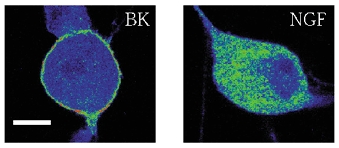
Typical images of neurones fixed and imaged in a confocal microscope as described in Methods. False-colour images with blue indicating low fluorescence and red high fluorescence. Scale bar: 10 μm.