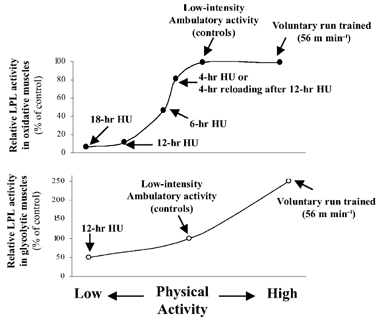
Figure 4. Summary of the dose-response relationship between physical activity/inactivity and muscle LPL.

Upper panel, summary of oxidative muscle sections (deep RQ and soleus); lower panel, summary of more glycolytic muscle sections (superficial white vastus lateralis and RF). Results for each muscle type are normalized to ambulatory control values. Absolute values for controls are shown in Fig. 2. Treadmill walking was at 8 m min−1. The data on the effects of low-intensity physical activity are from the current results, and those on high-intensity running (56 m min−1 3.5 h day−1) are from published work (Hamilton et al. 1998). The two studies used the same strain and vendor of rats.
