
Figure 7. Cell size and nuclear domains.
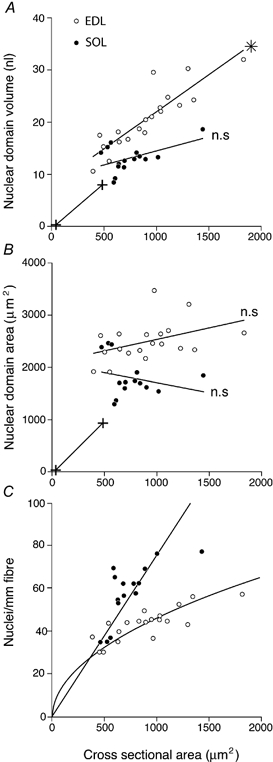
A, average nuclear cytoplasmic domain volumes; B, average cell surface domain areas; and C, nuclear density of EDL and soleus fibres with different cross-sectional areas. In C, the theoretical nuclear density with a constant nuclear cytoplasmic domain volume is denoted by a straight line and that with a constant nuclear sarcolemmal domain area by a curved line. The curves were constructed by least-squares linear and non-linear regression, assuming an unchanged form of the fibre. The linear regression coefficients were statistically different (*) or not different (n.s.) from 0.