
Figure 10. Nuclear row formation.
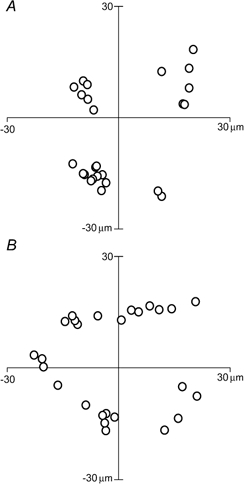
The distribution of the nuclei in two fibre segments seen from the end. A, the best example of nuclear preference for selected sectors of the circumference (P = 0.0006, Monte Carlo simulation). B, in this fibre the nuclei had a more random distribution around the circumference (not significant, Monte Carlo simulation).