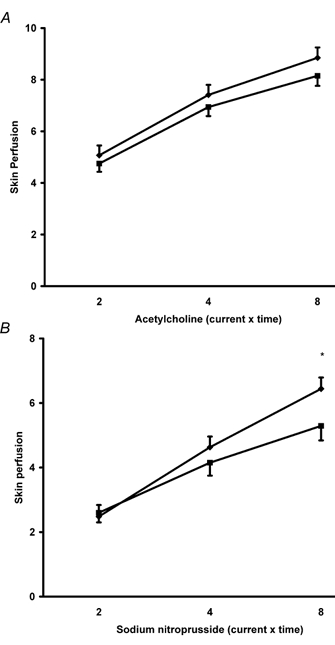
Figure 2. Comparison of microvascular responses to A, acetylcholine and B, sodium nitroprusside between subjects in the lower (n = 29) (♦) and upper (n = 29) (▪) glucose quintiles.

Subjects in the upper quintile showed significantly reduced responses to acetylcholine (P < 0.005, ANOVA) and sodium nitroprusside (P < 0.02, ANOVA). Values are means ± s.e.m. *P < 0.05 (post hoc test).
