
Figure 2. The correlation of the initial changes in CBF (coloured dots) with changes in [Ca2+]i (grey line) induced by 10 (A and B) or 100 μM (C and D) Br-cGMP.
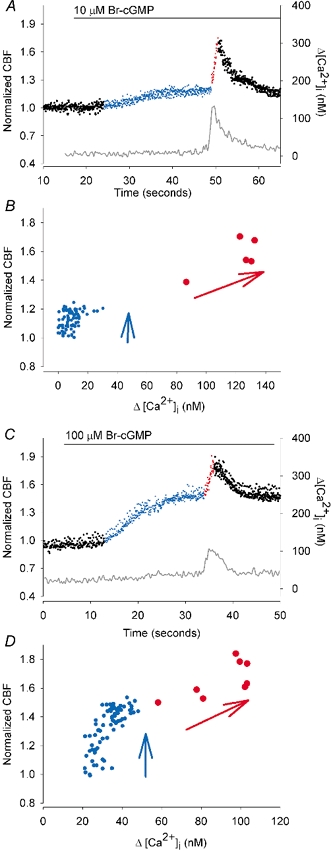
A, after the addition of 10 μM Br-cGMP, the CBF (normalized with basal CBF) slowly increased (blue dots) from the basal CBF (17.9 Hz, left black dots) while the [Ca2+]i remained unchanged. Approximately 30 s after the addition of Br-cGMP, the first transient increase in [Ca2+]i occurred and this was strongly correlated with a transient increase in CBF (red dots). B, the normalized CBF plotted against the corresponding [Ca2+]i for the time period illustrated in A. The vertical distribution of the blue dots, which represent the initial CBF increase induced by Br-cGMP, indicate that this phase of the response occurs independently of the [Ca2+]i. The inclined distribution of the red dots, which represent the CBF during the transient increase in [Ca2+]i, indicate that the CBF is dependent on the [Ca2+]i during this phase of the response. C and D, similar temporal and correlative representations of the changes in CBF and [Ca2+]i induced by 100 μM Br-cGMP. The initial increase in CBF (blue dots) is larger (basal CBF = 14.8 Hz) but still independent of the [Ca2+]i. The transient changes in CBF (red dots) are dependent on the [Ca2+]i.