
Figure 3. The concentration-response relationship of CBF and [Ca2+]i in airway epithelial cells to Br-cGMP.
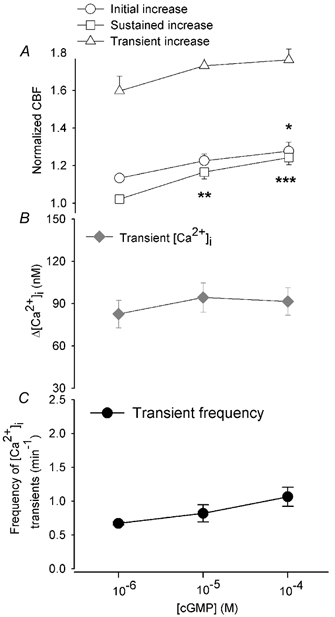
A, the initial increase in CBF (○) in response to 1, 10 and 100 μM Br-cGMP was 1.13 ± 0.02 (n = 10), 1.23 ± 0.04 (n = 11) and 1.28 ± 0.05, (n = 11), respectively, and was significantly greater (all P < 0.001) with respect to the basal rate with the increasing Br-cGMP concentration. The CBF increase induced by 100 μM Br-cGMP was also significantly greater than that induced by 1 μM Br-cGMP (*P < 0.05). The sustained increase in CBF (□) in response to 1, 10 and 100 μM Br-cGMP was 1.02 ± 0.02 (n = 10), 1.17 ± 0.04 (n = 11) and 1.24 ± 0.04 (n = 11), respectively, and this was also significantly greater (all P < 0.001) with the increasing Br-cGMP concentration. The sustained increase in CBF induced by 10 and 100 μM Br-cGMP was also significantly greater (**P < 0.01, ***P < 0.001) than that induced by 1 μM Br-cGMP. The transient increases in CBF (▵) in response to 1, 10 and 100 μM Br-cGMP were 1.60 ± 0.08 (n = 10), 1.73 ± 0.08 (n = 10) and 1.77 ± 0.06 (n = 11), respectively, but these were not significantly increased with increasing Br-cGMP concentration. The starting basal CBF (12.8 ± 0.9 Hz, n = 10; 11.9 ± 0.9 Hz, n = 11; 12.4 ± 0.6 Hz, n = 11) for each concentration of Br-cGMP was similar (P > 0.05). B, the concentration-response relationship of the transient change in [Ca2+]i to Br-cGMP. The transient changes in [Ca2+]i (♦) in response to 1, 10 and 100 μM Br-cGMP were 83 ± 10 nM, (n = 10), 94 ± 10 nM (n = 9) and 92 ± 10 nM (n = 10), respectively, but were not significantly different with increasing Br-cGMP concentration (P > 0.05). The basal [Ca2+]i (30 ± 4 nM, n = 10; 36 ± 4 nM, n = 11; 32 ± 5 nM, n = 11) for each concentration was similar (P > 0.05). C, the concentration-response relationship of the frequency of the transient changes in [Ca2+]i or CBF oscillations (•) to Br-cGMP. The frequency in response to 1, 10 and 100 μM Br-cGMP was 0.67 ± 0.02 min−1 (n = 5), 0.82 ± 0.13 min−1 (n = 5) and 1.07 ± 0.14 min−1 (n = 4), and not significantly different with the increasing Br-cGMP concentration (P > 0.05).