
Figure 8. The effect of KT5823 treatment on ATP-induced changes in CBF and [Ca2+]i.
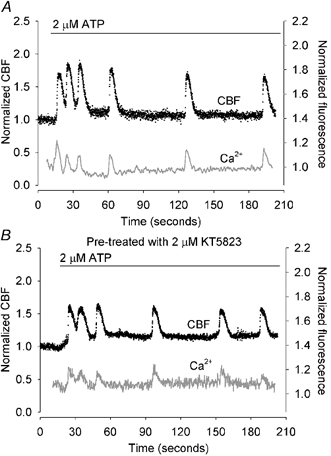
A, a representative trace of the simultaneous changes in CBF (black dots) and [Ca2+]i (grey line) in ciliated epithelial cells in response to 2 μM ATP (bar). ATP induced a rapid increases in CBF and [Ca2+]i which was followed by oscillations in both CBF and [Ca2+]i. The CBF oscillations occurred from an elevated minimum CBF while the [Ca2+]i oscillations occurred from a baseline that declined to the basal level. B, ATP induced a similar response in CBF and [Ca2+]i in cells that were pretreated with 2 μM KT5823 (n = 5).