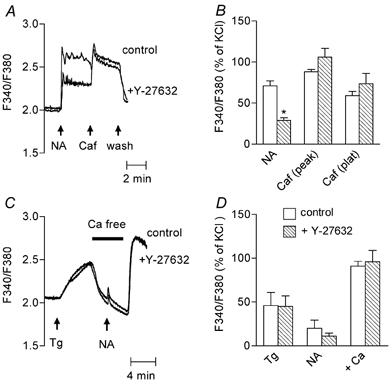
Figure 11. Effect of Y-27632 on the Ca2+ signal evoked by caffeine or thapsigargin in fura-2-loaded aorta.

A, representative recording of the effect of pre-incubation of the aorta with Y-27632 (10 μM) on the Ca2+ signal evoked by caffeine. Noradrenaline (NA, 1 μM) was applied 3 min before stimulation with caffeine (Caf, 10 mM). Traces obtained before and after incubation with Y-27632 are superimposed. They were obtained from the same aortic ring. B, bar graph showing mean values of the Ca2+ signal evoked by noradrenaline (NA); caffeine measured at the peak (Caf peak) and the plateau of the response (Caf plat) in control (□) and in Y-27632-treated aorta (□). Data were normalised to the response to 100 mM KCl and are means from 4 determinations ±s.e.m.*P < 0.05, Y-27632-treated vs. untreated aortas. C, representative recording of the effect of Y-27632 on Ca2+ signal evoked by thapsigargin. Thapsigargin (Tg, 1 μM) and noradrenaline (NA, 1 μM) were applied as indicated by the arrows. The physiological solution was changed to a Ca2+-free solution as indicated by the horizontal bar. Traces obtained without and with Y-27632 (10 μM) are superimposed. They were obtained from different aortic rings. D, bar graph showing mean values of Ca2+ signal evoked by thapsigargin (Tg), noradrenaline (NA) measured at the peak of the response in Ca2+-free solution, and after re-admission of Ca2+ (1.25 mM) to the solution (+Ca) in control (□) and in Y-27632-treated aorta (□). Effect of re-addition of Ca2+ was measured with reference to the baseline fluorescence ratio measured in Ca2+-containing solution. Data were normalised to the response to 100 mM KCl and are means from 4 determinations ± S.E.M.
