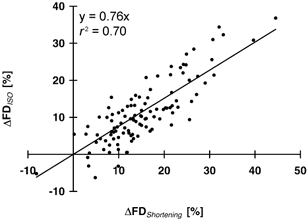
Figure 11. Differences in force depression during the shortening and steady-state isometric phases.

Differences in force depression at the end of the shortening phase (ΔFDShortening) and during the steady-state isometric phase (ΔFDISO). Data are from all 108 electrically stimulated contractions of protocol 1.
