
Figure 5. Effects of ethanol on intracellular Ca2+ concentration shown as changes in fura-2 fluorescence ratio (F340/F380) in guinea-pig pancreatic duct cells.
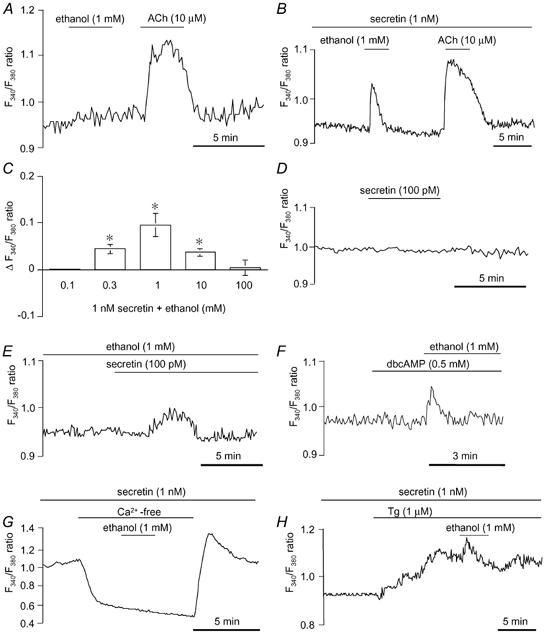
A and B, effects of 1 mM ethanol and 10 μM ACh on [Ca2+]i in unstimulated (A) and secretin (1 nM)-stimulated (B) ducts. C, effects of ethanol concentration (0.1–100 mM) on [Ca2+]i (means ±s.e.m. of change in fluorescence ratio (ΔF340/F380 ratio; n = 4) in ducts stimulated with 1 nM secretin. * Significant differences (P < 0.05). D and E, effects of 100 pM secretin on [Ca2+]i in the absence (D) and presence (E) of 1 mM ethanol. F, effects of 1 mM ethanol on [Ca2+]i in dbcAMP (0.5 mM)-stimulated ducts. G, effects of 1 mM ethanol on [Ca2+]i in secretin (1 nM)-stimulated ducts superfused with Ca2+-free solution. H, effects of 1 mM ethanol on [Ca2+]i in secretin (1 nM)-stimulated ducts in the presence of 1 μM thapsigargin (Tg). Each trace is representative of 4 experiments.