
Figure 1. V̇O2 kinetic response in the transition to moderate intensity exercise following infusion of l-NAME (○) and in control condition (•).
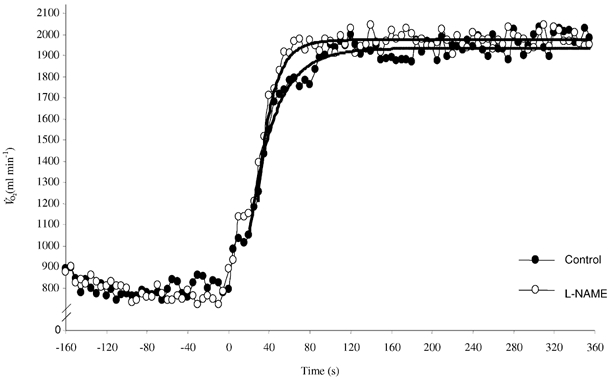
Notice the faster adjustment in the l-NAME condition. Continuous lines represent mono-exponential curve fits to the data.