
Figure 1. Estimating the reversal potential (Irev) of Ih in area postrema neurons.
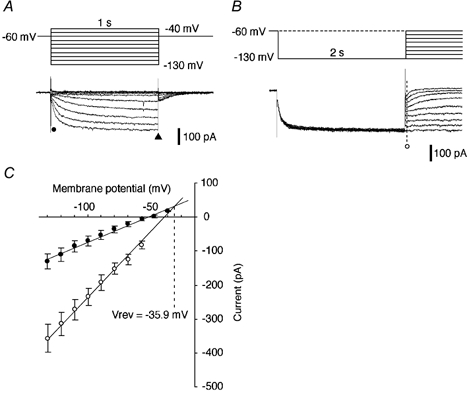
A, slowly activated inward current elicited by hyperpolarizing step pulses (upper traces). Interval between voltage step commands: 3 s in this and subsequent figures. The holding potential was −60 mV in this and subsequent voltage-clamp recordings. An ‘instantaneous’ current (Iin) was measured at the point marked •. A ‘steady state’ current (Iss) was measured at the end of the voltage steps (▴). B, hyperpolarizing prepulses and following step pulses (upper traces) elicited deactivation of Ih. The interval between voltage step commands was 4 s; Iin was measured at the point marked ○. C, plots of Iin obtained in the experiments shown in A (•) and B (○) against the membrane potential (n = 19). The dashed line indicates the value of the membrane potential (−35.9 mV) at the intersection of the two regression lines, which corresponds to the Vrev of Ih. All recordings were made in ACSF containing TEA, Ba2+, 4-AP, TTX and nominally zero Ca2+ (see Methods).