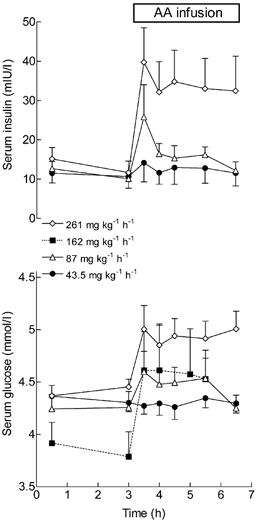
Figure 2. Changes in the concentrations of serum insulin and glucose during the infusion of mixed amino acids at four different rates.

Serum insulin (top) and glucose (bottom) concentrations during infusion of mixed amino acids (AA infusion). Values are means ± s.e.m. for 4-6 subjects per point.
