
Figure 4. Effect on mixed MPS of extracellular and intramuscular levels of EAAs.
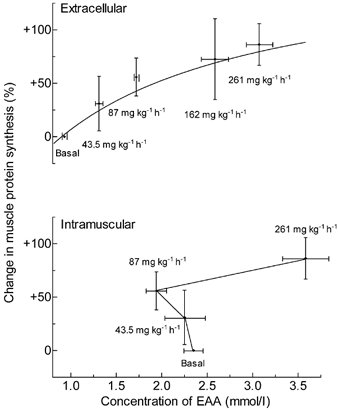
Upper panel, the effect on mixed MPS (measured as incorporation of D5-Phe or D3-leucine) in human skeletal muscle of extracellular EAA concentrations achieved by infusion of a mixed amino acid solution at different rates (shown near each point). Lower panel, the effect on mixed MPS (measured as incorporation of D5-Phe) in human skeletal muscle of intramuscular EAA concentrations achieved by infusion of a mixed amino acid solution at different rates (shown near each point). Values are means ± s.e.m. for 4-6 subjects per point (with the exception for the 11 subjects at basal), each point being the mean value of the individual changes in MPS and the mean EAA concentration over the period of measurement. The upper curve fits the equation: MPS = 2.68 ×[EAA]/(1.51 +[EAA]). No curve fit has been attempted for the lower graph.