
Figure 9. The effect of blocking glutamate transporters with a combination of TBOA, DHK and GLAST knock out.
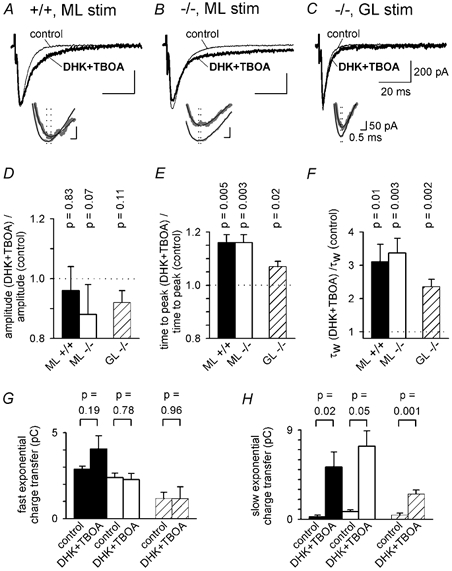
A, parallel fibre EPSCs evoked by molecular layer (ML) stimulation in a wild-type (+/+) Purkinje cell in the absence (control) and presence of 200 μM DHK + 200 μM TBOA. Inset shows time at peak of the EPSCs (vertical dotted lines); smooth black curves through grey data are multi-exponential fits to define the peak better and the thicker trace is in DHK + TBOA. B, As for A, but in a GLAST knock-out (−/-) cell. C, as for B, but with stimulation in the granular layer (GL). D-F, mean values of EPSC amplitude (D), time from the start of the stimulus to the peak of the EPSC (E), and weighted decay time constant (F) in DHK + TBOA relative to the value in the same cell in control solution, for 6 wild-type cells stimulated in the ML (control EPSC amplitude was 666 ± 33 pA), 6 knock-out cells stimulated in the ML (control EPSC amplitude was 615 ± 46 pA, P = 0.39 compared with wild-type), and 6 knock-out cells stimulated in the GL (control EPSC amplitude was 483 ± 50 pA, P = 0.08 compared with ML stimulation). P values are for t tests comparing data with unity. G and H, charge transfer by the faster (G) and slower (H) exponential components of eqn (1), in the absence and presence of DHK + TBOA, for the cells of D-F (black bars: ML +/+; white bars: ML −/−; shaded bars: GL −/−). P values are for paired t tests comparing data with and without DHK + TBOA. The amplitudes and time constants of the fast and slow exponential components of the EPSC decay (in the order Afast, τfast, Aslow, τslow) were as follows. For ML stimulation in wild-type, in control: 597 ± 33 pA, 4.80 ± 0.15 ms, 18.6 ± 15.8 pA, 23.0 ± 10.5 ms (2 out of 6 cells showed a slow component); in DHK + TBOA: 450 ± 34 pA, 8.92 ± 1.57 ms, 121 ± 26 pA, 42.6 ± 5.6 ms (all cells showed a slow component). For ML stimulation in knock-out, in control: 511 ± 26 pA, 5.20 ± 0.62 ms, 30.3 ± 14.1 pA, 33.6 ± 12.2 ms (all cells showed a slow component); in DHK + TBOA: 377 ± 61 pA, 6.53 ± 1.14 ms, 97.8 ± 11.9 pA, 79.9 ± 21.0 ms (all cells showed a slow component). For GL stimulation in knock-out, in control: 389 ± 77 pA, 2.91 ± 0.32 ms, 34.3 ± 21.3 pA, 17.3 ± 8.4 ms (3 out of 6 cells showed a slow component); in DHK + TBOA: 383 ± 37 pA, 3.43 ± 0.31 ms, 28.4 ± 3.6 pA, 87.6 ± 9.8 ms (all cells showed a slow component).