
Figure 3. Plots of AHP compound trajectories (A-C) and corresponding STA twitches (D-F) for 3 different motor units.
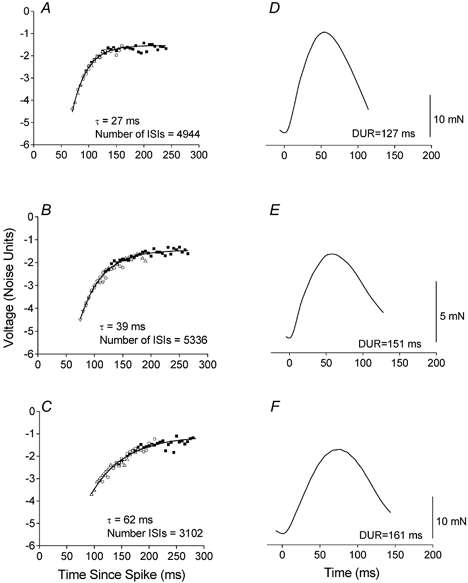
Note a longer time constant (τ) was associated with longer twitch durations. The compound trajectory in A was derived from the sliced histograms in Fig. 2. The different symbols correspond to transforms performed on separate sliced histograms (i.e. 3, 4 and 3 ISI histograms were transformed to create the compound trajectories in A, B and C, respectively).