
Figure 1. Characterisation of cerebellar Purkinje BK channels as a function of ‘basal’ activity.
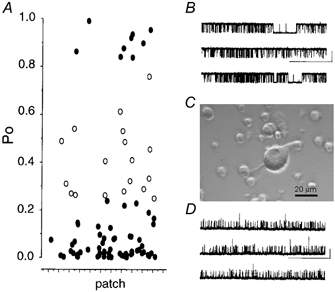
A, mean channel open probabilities (Po) plotted for each isolated inside-out patch in which the maximal number of channels was determined. All recordings were performed in the absence of any treatment in equimolar K+ gradient with 1 μM free calcium and 1 mM ATP with the membrane depolarised to +40 mV (n = 91). Channels with mean Po below or equal to 0.25, as well as Po above 0.8, are represented as filled circles. Channels with intermediate Po values (i.e. between 0.25 and 0.8) are represented as open circles. B and D, representative traces from ‘high’ activity (B, Po = 0.92) and ‘low’ activity (D, Po = 0.02) channel under identical recording conditions as above. (Scale bars: 10 pA, 20 s.) C, representative photograph of a freshly dissociated cerebellar Purkinje cell body from a 12-day-old rat. Note the large size of the Purkinje cell body, with characteristic ‘pear’ shape with dendritic stump and some axonal extension retained during cell isolation, with respect to the smaller cerebellar granule cells isolated in parallel.