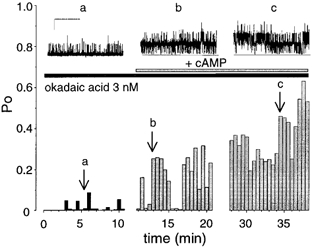
Figure 4. Sustained activation of ‘low’ activity BK channels by cAMP in the presence of 3 nM okadaic acid.

Representative traces and corresponding diary plot of channel open probability against time from a patch expressing ‘low’ activity (stable starting Po < 0.25) BK channels pretreated with 3 nM okadaic acid and exposed to cAMP. The arrows labelled a, b, and c, indicate the channel activity for the different traces illustrated in the upper panels. (Scale bars: 10 pA, 10 s.)
