
Figure 2. Improved coincidence detection at higher temperatures.
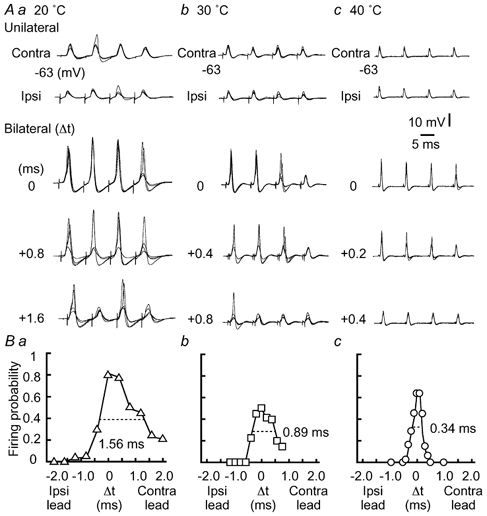
A, four superimposed voltage traces in response to unilateral stimuli or bilateral stimuli with three different time intervals between the two sides (Δt in ms, indicated in the figure, see Methods). In A and B, at 20 °C (a), 30 °C (b), and 40 °C (c). The resting membrane potential is indicated at the left of each trace here and in subsequent figures. B, probability of spike generation as a function of Δt calculated from the neurons in A. The time window is indicated by the horizontal broken line.