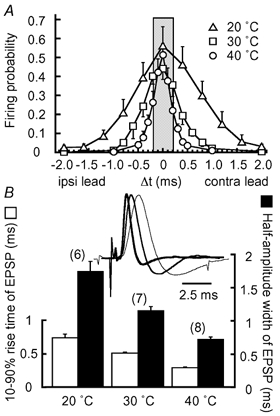
Figure 3. Acceleration of EPSP time course improves coincidence detection.

A, firing probabilities calculated from 6 cells at 20 °C (▵), 7 cells at 30 °C (□), and 8 cells at 40 °C (○). The grey area indicates the physiological range of ITD in the chick (< 0.2 ms) (Hyson et al. 1994). B, 10-90 % rise time (open column) and half-amplitude width (filled column) of EPSP from the neurons in A. The numbers in parentheses are the numbers of cells, here and in subsequent figures. Inset, subthreshold EPSPs are size-normalized and superimposed to show the progressive acceleration with the increase in temperature; 20 °C (thin trace), 30 °C (intermediate trace), and 40 °C (thick trace).
