
Figure 6. Ap4A and ATP compete for the same site to inhibit KATP channels.
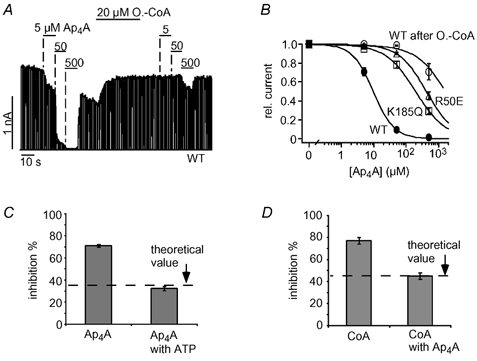
A, Ap4A inhibited cardiac KATP currents in a concentration-dependent manner and application of 20 μM oleoyl-CoA greatly reduced Ap4A inhibition. B, concentration-response curves for Ap4A inhibition of WT, R50E and K185Q channels, and WT channels after oleoyl-CoA (A); fits to standard Hill equations with Ki(Ap4A) values of 10 ± 1 μM (WT), 438 ± 77 μM (R50E) and 200 ± 35 μM (K185Q). C, inhibition of KATP currents by 16 μM Ap4A in the presence and absence of 40 μM ATP is plotted as means ± S.E.M. The dashed line represents the expected theoretical value for current inhibition by 16 μM Ap4A in the presence of 40 μM ATP assuming direct competition between Ap4A and ATP. To obtain this value, the amount of Ap4A inhibition (in the absence of ATP) was used to calculate the ATP concentration (14.5 μM) necessary to produce the same inhibition using a concentration-response curve as in Fig. 1C. Accordingly, the theoretical value represents the expected increase in ATP inhibition produced by a rise in the ATP concentration from 40 μM to (40 + 14.5) μM. D, inhibition of KATP currents by 333 μM CoA in the presence and absence of 40 μM Ap4A is plotted as means ± S.E.M. The dashed line represents the expected theoretical value for current inhibition by 333 μM CoA in the presence of 40 μM Ap4A assuming direct competition between CoA and Ap4A (the theoretical value was calculated as described in C).