
Figure 5. Averaged surface EMG response (line with light grey shading underneath) and histogram of motor unit firings for the experiment illustrated in Fig. 1 and for the first 10 min of the experiment shown in Fig. 2.
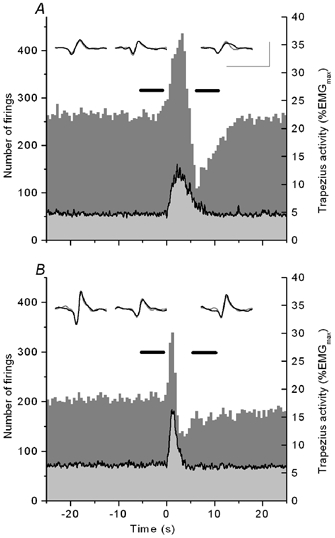
Ten EMG pulses are included, with responses centred at the start of the EMG pulse. Insets show surface representations of motor units nos 1-3 in the two experiments, derived by spike-triggered averaging before (grey) and after (black) the EMG pulse. Calibration bars indicate 100 μV and 50 ms (A and B). The triggering pulses are located to intervals marked by horizontal bars above the histograms. The marked dip in firings starts halfway into the down phase of the EMG pulse.