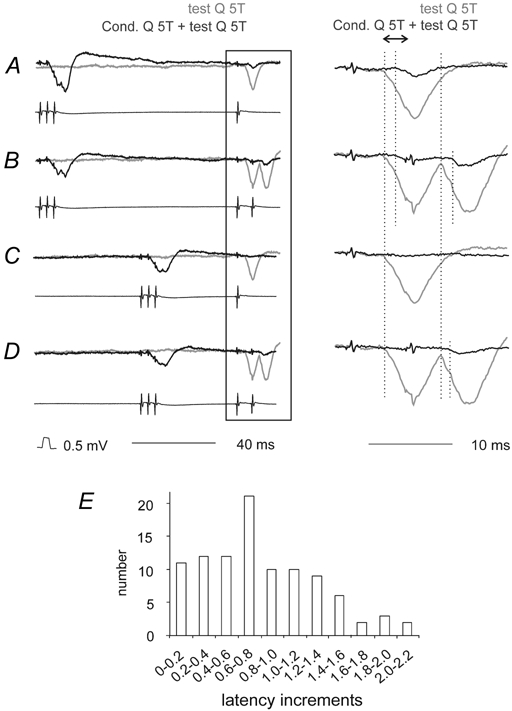
Figure 2. Effects of conditioning stimulation of contralateral group II afferents on short latency IPSPs evoked from contralateral group II afferents in motoneurones.

A and B, IPSPs evoked in a GS motoneurone by single and double stimuli to contralateral group II afferents. Upper records are intracellular potentials; the lower parallel records show afferent volleys from the cord dorsum. Control (unconditioned) responses are shown in grey and conditioned responses in black. The conditioning–testing interval was 94 ms. The panels on the right show expanded records of the responses to the test stimuli (from the parts of the left hand records within the box). C and D, as A and B but with a conditioning–testing interval of 45 ms. For all traces the vertical dotted lines indicate the onsets of the conditioned and unconditioned IPSPs. The double arrow above the right panel in A shows the time window within which the areas of the IPSPs were measured. F, increments in the latency of IPSPs evoked by conditioning stimulation of Q in all cases in which IPSPs with a distinct onset were evoked (n = 101). In this and the following figures, the negativity is downwards in the microelectrode records and upwards in the records from the cord dorsum.
