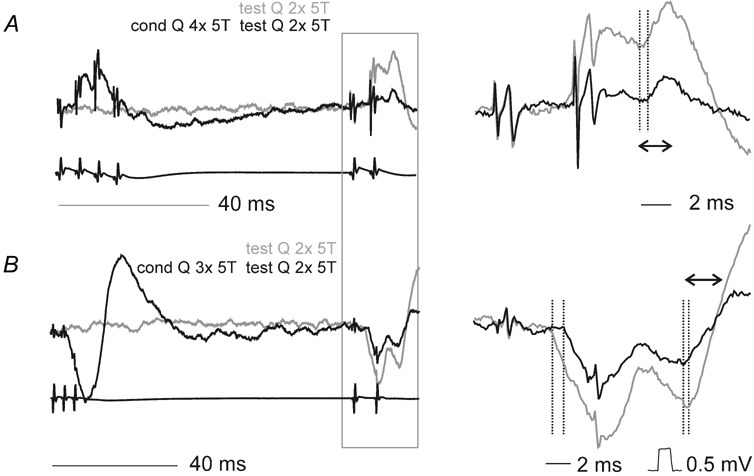
Figure 3. Effects of conditioning stimulation of contralateral group II afferents on EPSPs evoked from contralateral group II afferents in motoneurones.

A and B, records from Q and PBST motoneurones respectively (upper traces) and cord dorsum potentials (lower traces). Unconditioned responses are shown in grey and conditioned (cond) responses in black. The panels on the left show records at a slow timebase, the panels to the right show the responses to the test stimuli (from the box in the lefthand panels) expanded (twice vertically four times horizontally). Dotted lines in the panels on the right indicate the onset of the unconditioned and conditioned PSPs. The double arrows in the right panels show the time windows within which the areas of the PSPs were compared.
