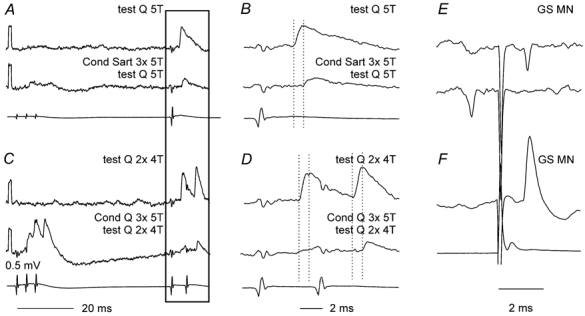
Figure 7. Differential effects of presynaptic inhibition on early and later components of EPSPs evoked from group II afferents in a commissural interneurone.

A, control EPSP (upper trace) evoked by near maximal stimulation of Q group II afferents, which shows a decrease in amplitude and increase in latency following heterogenetic conditioning stimuli (Sart, second trace, conditioning–testing interval of 56 ms). B, horizontally expanded parts of records in boxed areas in A. C, as A but for homogenetic depression (Q) and for EPSPs evoked by double instead of single test stimuli. D, expanded parts of records in C. Dotted lines in the expanded records indicate the onset of the control and conditioned EPSPs. E, extracellular records of antidromically evoked spike potentials in the interneurone and collision by synaptically evoked spikes. F, intracellular record of the blocked antidromic spike. Bottom traces in A–D and F are from the cord dorsum. Negativity is downwards in the microelectrode records and upwards in the records from the cord dorsum. Voltage calibration in C is for all the microelectrode records.
