
Figure 1. Schematic illustration of electrode localization in the angular bundle for stimulation and the hilar region of the dentate gyrus for recording.
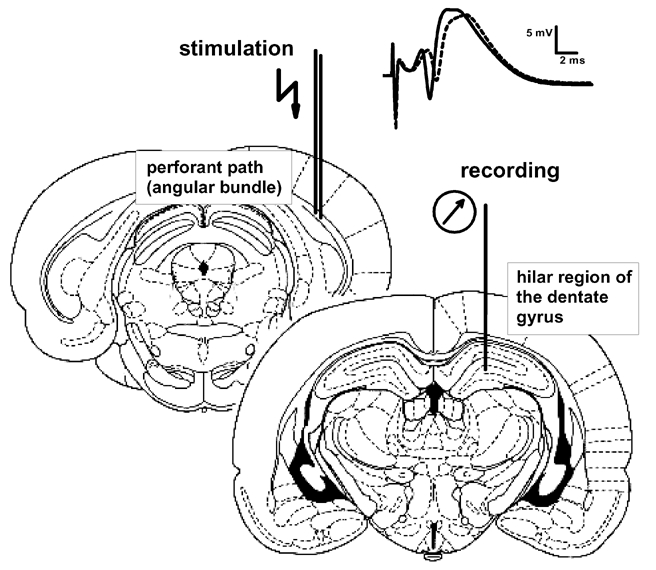
Insets show analogue examples of recordings obtained before (dashed line) and after LTP-induction (continuous line) of the perforant path (upper right). Notice the increase in the PSA (downwards spike-like deflection) and the small increase in the slope of the population excitatory postsynaptic potential (first upward deflection). The PSA was used as an indicator of potentiation.