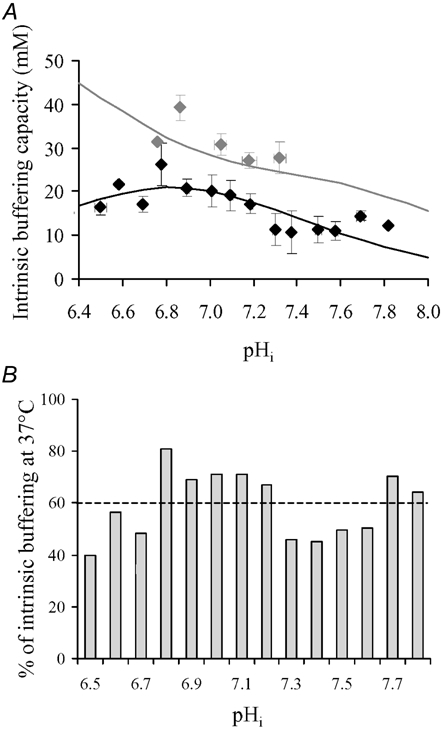
Figure 3. Temperature dependence of intracellular intrinsic buffering.

A, data pooled for intrinsic buffering measured at 37°C (grey diamonds) and 27°C (black diamonds) from cells prepulsed either with ammonium chloride or sodium acetate. Also shown (continuous grey line) is a previously determined relationship of the pHi dependence of intrinsic buffering at 37°C (from Leem et al. 1999), calculated using eqn (1) in Methods. This was cross-checked against the sample measurements of βi conducted at 37°C (grey diamonds). For convenience, the continuous black line drawn through the points at 27°C was fitted arbitrarily by a single buffer function (eqn (1)), concentration 36.5 mm and pKa 6.83. At 27°C, all data points averaged for n = 4–14, except at pHi 6.36 and 6.5 (each, n = 2), 6.58 and 7.82 (each, n = 1). At 37°C, data points averaged for n = 3, except at pHi 7.32 and 7.05 (each, n = 2) and 6.76 (n = 1). Note that for n = 2, the upper and lower s.e.m. represent the individual data points. B, intracellular buffering capacity measured at 27°C, expressed as a percentage of that computed at 37°C, has been plotted versus pHi. Over the whole pHi range tested, the mean reduction in buffering capacity during hypothermia is 40 % (indicated by horizontal dashed line).
