
Figure 5. Activation and inactivation of ICa in immature IHCs.
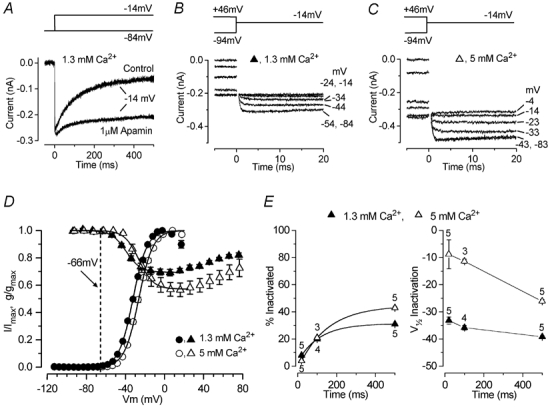
A, inward currents in a P5 IHC during 500 ms depolarizing steps to −14 mV from a holding potential of −84 mV, before and during extracellular application of 1 μm apamin. Extracellular Ca2+ was 1.3 mm throughout the experiment. Recordings are single traces. B and C, tail currents at a membrane potential of −14 mV were used to derive the inactivation curves (see text for details). Some of the conditioning voltages are shown next to the traces. Residual capacitative transients were blanked. Conditioning steps were 500 ms in duration from −94 mV to more positive values in 10 mV increments. The holding potential was −84 mV. B and C are both averages from two repetitions. Recordings in A-C are from the same IHC, and the recording conditions were: Cm 7.0 pF; Rs 7.2 MΩ; gleak 1.7 nS; temperature 37°C. D, activation of ICa from seven P6-P7 IHCs (circles),including the cell shown in Fig. 4A and B, and inactivation of ICa from five P5 IHCs (triangles), including the cell shown in B and C, in 1.3 and 5 mm extracellular Ca2+. Inactivation followed 500 ms conditioning steps. The dashed line is −66 mV, the average resting membrane potential for P5-P7 apical-coil IHCs. The continuous lines are fits calculated using eqn (3) for activation and eqn (4) for inactivation (see text for details). The fitting parameters for activation are: in 1.3 mm Ca2+ (•), gmax7.0 nS, V1/2-32.3 mV, S 7.2 mV; in 5 mm Ca2+ (○), gmax 13.0 nS, V1/2−26.4 mV, S 7.3 mV. Parameters for inactivation were: in 1.3 mm Ca2+ (▴), Imax−316 pA, Iconst 0.69 Imax, V1/2−39.2 mV, S 7.4 mV; in 5 mm Ca2+ (▵), Imax−510 pA, Iconst 0.57 Imax, V1/2−26.1 mV, S 7.3 mV. E, percentage of inactivation and V1/2 of inactivation (derived from the fit of the inactivation curves using eqn (4)) when 20, 100 and 500 ms conditioning pulses were applied in the same P5 IHCs using 1.3 and 5 mm extracellular Ca2+.