
Figure 8. Quantitative effects of TTX on action-potential timing.
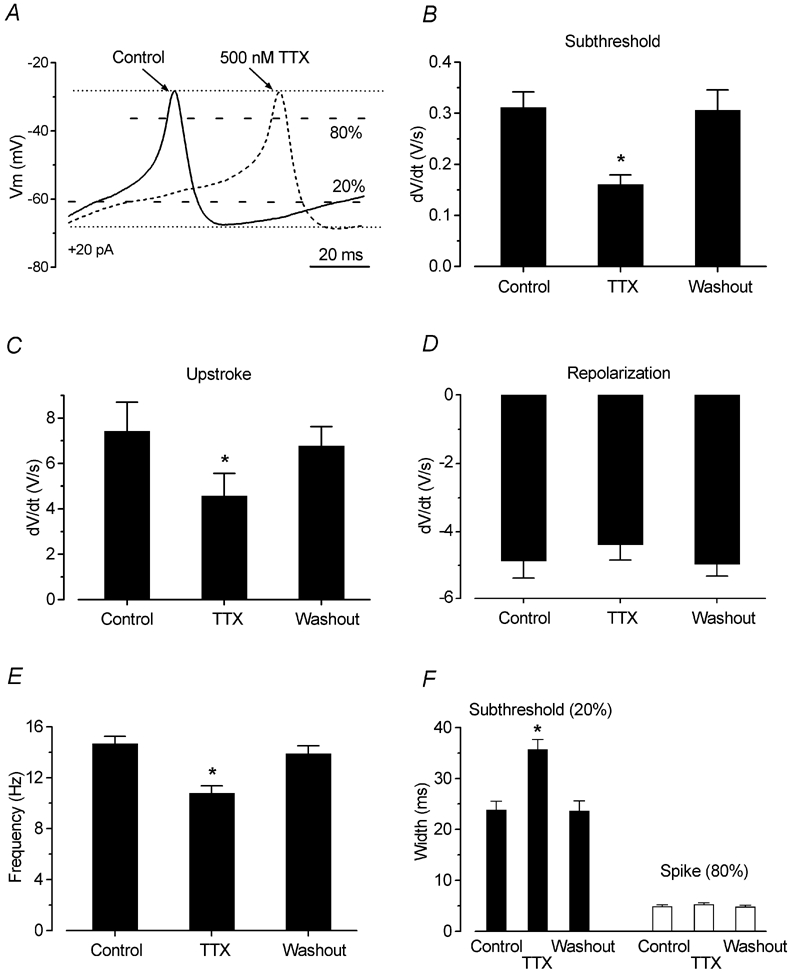
A, enlarged representation of voltage responses from Fig. 7F before (continuous line) and during (dashed line) superfusion of TTX. The 20 % and 80 % labels indicate the height at which the widths of the action potentials were measured, between the peak and the maximum repolarization levels (dotted lines). B, C and D, rate of subthreshold depolarization, upstroke and repolarization, respectively, of the action potentials before, during and after extracellular application of 300–500 nm TTX (n = 14). E, change in spike frequency during extracellular superfusion of TTX. F, width of the action potentials measured at the two levels shown in A.