
Figure 4. HPLC of final plasma after 168 h of tracer infusion.
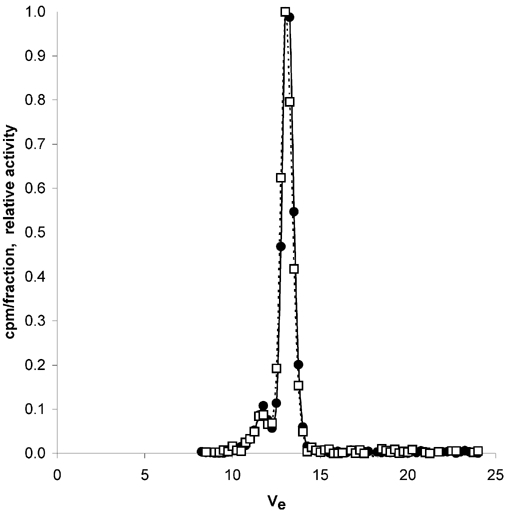
Radioactivity of cHSA (•) and HSA (□) in successive collections of excluded volume fractions Ve (ml) from a Superose 12 size exclusion column after applications of plasma final samples collected at t = 168 h of continuous infusion. The optimal separation range of the column is 1–300 kDa.