
Figure 6. Presence of GABA and GABAB receptors in type I cells.
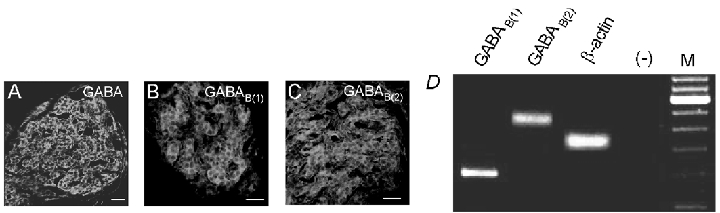
Confocal images showing carotid body sections which were immunostained with a specific antibodies raised against GABA (A), GABAB(1) (B) and GABAB(2) (C) receptor subunits and visualised by secondary FITC fluorescence. Positive immunostaining of type I clusters is seen in each case. Scale bars represent 20 µm. In all cases, staining was abolished either when sections were exposed to the secondary antibody without prior exposure to the primary antibody, or in the case of GABA the primary antibody was pre-adsorbed with excess antigen (not shown). D, micrograph of a 2 % agarose gel stained with ethidium bromide and viewed under UV illumination. RT-PCR was carried out on isolated type I clusters following extraction of mRNA, and using gene-specific primers for the GABAB(1) and GABAB(2) subunits, and β-actin. Marker lane (M) shows bands at 100 bp increments with the 600 bp fragment at increased intensity. In negative control reactions without RT (−) no PCR products were observed.