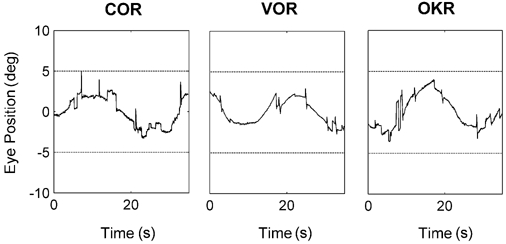
Figure 5. Typical traces from the synergy test.

These graphs show horizontal position traces from a 26-year-old subject, in response to cervical (COR), vestibular (VOR) and optokinetic (OKR) stimulation. Horizontal lines indicate stimulus amplitude.

These graphs show horizontal position traces from a 26-year-old subject, in response to cervical (COR), vestibular (VOR) and optokinetic (OKR) stimulation. Horizontal lines indicate stimulus amplitude.