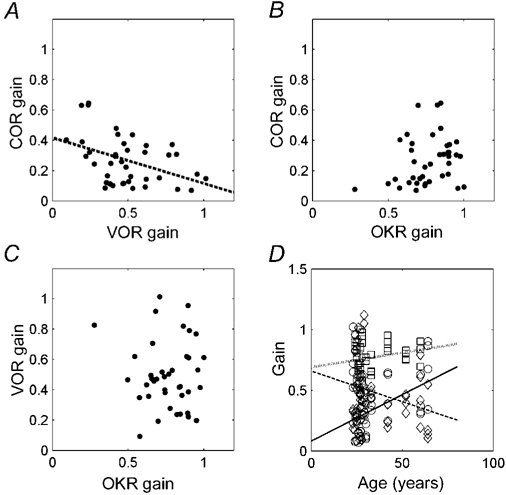
Figure 7. Correlations between the reflex gains (A-C) and between gain and age (D).

In A the dotted line is a linear fit. In D different symbols indicate the COR (continuous line, ○), the VOR (broken line, ⋄), and the OKR (dotted line, □).

In A the dotted line is a linear fit. In D different symbols indicate the COR (continuous line, ○), the VOR (broken line, ⋄), and the OKR (dotted line, □).