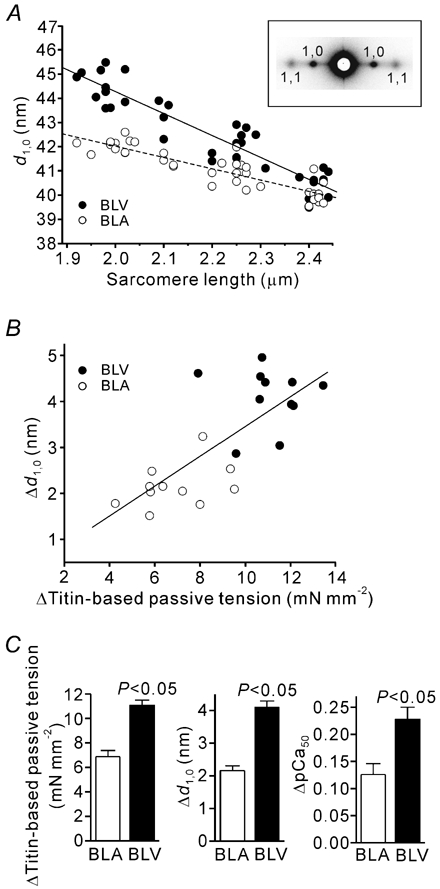
Figure 6. Interfilament lattice spacing in BLV and BLA.

A, changes in d1,0 with SL in BLV and BLA. Lines are linear regression fits for BLV (coninuous line) (y = −9.06x + 62.36 (r2 = 0.865, P < 0.0001)) and BLA (dashed line) (y = −4.66x + 51.35 (r2 = 0.783, P < 0.0001)). The slope of the linear regression line was significantly (P < 0.001) greater in BLV than in BLA. Eleven preparations were used (BLV and BLA). Inset, X-ray patterns from BLA at SL 2.4 µm showing sharp equatorial reflections. B, linear regression analysis of the relation between titin-based passive tension and d1,0 when SL was increased from the slack length (1.9-2.0 µm) to ∼2.4 µm. ▵d1,0, difference in d1,0 at the slack length and SL ∼2.4 µm. A significant correlation is present (y = 0.33x + 0.19 (r2 = 0.572, P < 0.0001)). C, ▵Titin-based passive tension, ▵d1,0 and ▵pCa50 (same as in Fig. 2A inset) in BLV and BLA. All measurements were made at quasi steady-state passive tension.
