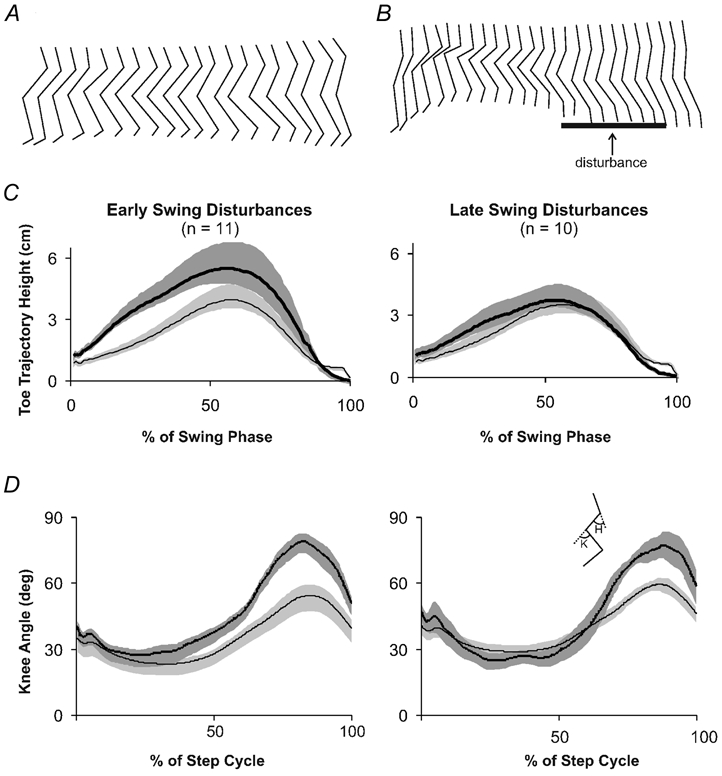
Figure 2. Kinematic data from steps with swing phase disturbances.

A, stick figure of an infant's leg during the swing phase of an undisturbed step. B, stick figure of the same infant's leg during a disturbed step. Thick horizontal line represents the presence of the mechanical disturbance. In A and B, the time between each stick figure is 33 ms. Stick figures are equally spaced for clarity. C, toe trajectory during the swing phase of steps with early (left panel) or late (right panel) swing disturbances. D, knee angle during steps with early swing disturbances (left panel) and late swing disturbances (right panel). In both C and D, thick black lines represent the average angle during disturbed steps and thin black lines represent the average angle from control steps. Shaded areas represent 1 s.e.m. Inset stick figure represents the measured angles (K, knee; H, hip). Upward deflections are flexion; n, the number of infants contributing data to each figure.
