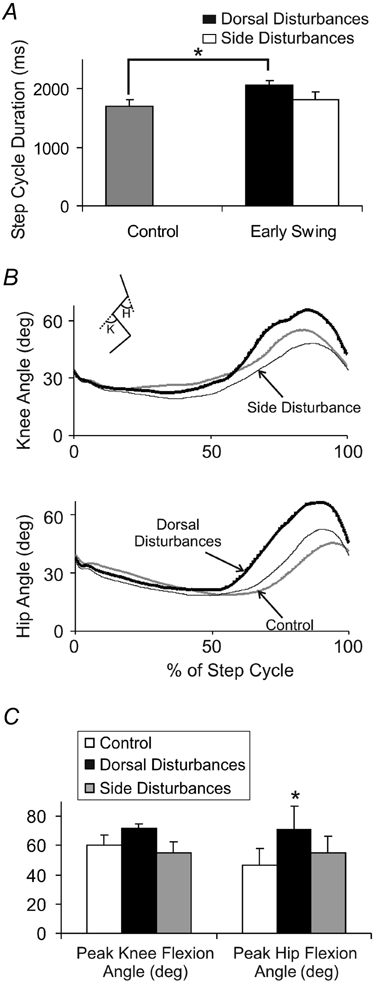
Figure 5. Comparison of disturbances to the dorsum of the foot compared with the side of the foot during forwards stepping.

A, average step cycle duration during steps with disturbances to the dorsum of the foot (black bar) and disturbances to the side of the foot (white bar) compared to control (grey bar). The significant prolongation of step cycle duration seen with early swing disturbances to the dorsum of the foot (indicated by asterisk) was not observed with early swing disturbances to the side of the foot. Error bars represent 1 s.e.m.B, knee angle (top panel) and hip angle (bottom panel) during steps with side disturbances (thin lines) compared to steps with dorsal disturbances (thick lines) and control steps (grey lines). Traces are aligned to foot contact. Inset stick figure represents the measured angles (K, knee; H, hip). Upward deflections are flexion. C, average peak knee flexion angle (left panel) and average peak hip flexion angle (right panel) during the swing phase. * P < 0.05. All data in this figure represent the average values across the 8 infants in section 2.
